BEP Bachelor End Project
- Area: Electronics
- Topics: Transmission Lines · S-Parameters and Impedance Matching
- Related courses: Components in Wireless Technologies - 5XTC0 · Electromagnetics II - 5EPB0
Getting Started Information
Contacts
Primary:
Daniel Tyukov (d.tyukov@student.tue.nl)
Vojkan Vidojkovic (v.vidojkovic@tue.nl)
Marco Fattori (m.fattori@tue.nl)
Georgi Radulov (g.radulov@tue.nl)
Timo Matray (t.m.matray@tue.nl)
Secondary:
Niek Kesteloo (n.kesteloo@tue.nl)
Issac Wang (w.wang5@tue.nl)
Rooms of Interest:
Flux 8.070 Lab
Preliminary BEP Info
General description
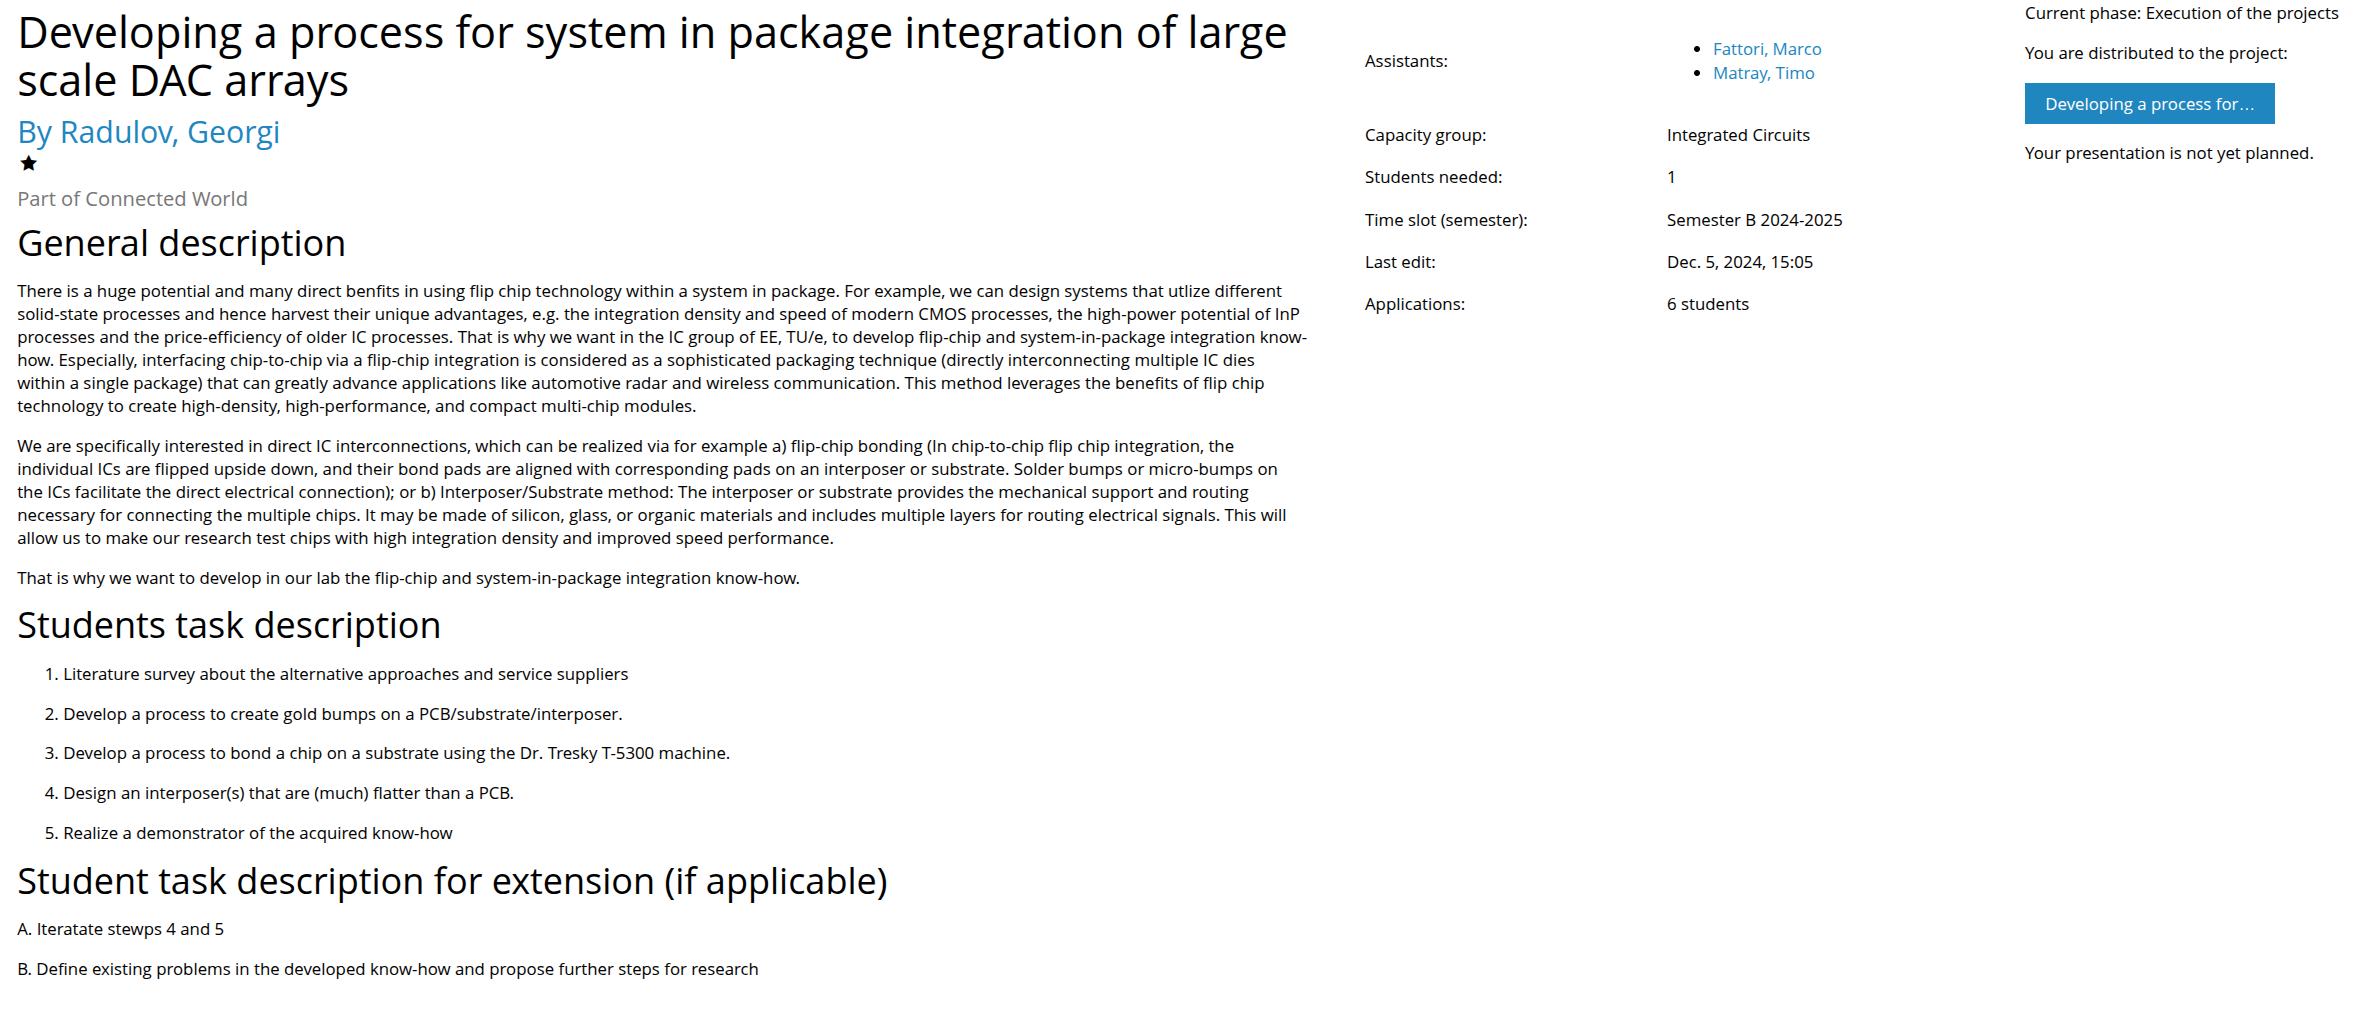
There is a huge potential and many direct benfits in using flip chip technology within a system in package. For example, we can design systems that utlize different solid-state processes and hence harvest their unique advantages, e.g. the integration density and speed of modern CMOS processes, the high-power potential of InP processes and the price-efficiency of older IC processes. That is why we want in the IC group of EE, TU/e, to develop flip-chip and system-in-package integration know-how. Especially, interfacing chip-to-chip via a flip-chip integration is considered as a sophisticated packaging technique (directly interconnecting multiple IC dies within a single package) that can greatly advance applications like automotive radar and wireless communication. This method leverages the benefits of flip chip technology to create high-density, high-performance, and compact multi-chip modules.
We are specifically interested in direct IC interconnections, which can be realized via for example a) flip-chip bonding (In chip-to-chip flip chip integration, the individual ICs are flipped upside down, and their bond pads are aligned with corresponding pads on an interposer or substrate. Solder bumps or micro-bumps on the ICs facilitate the direct electrical connection); or b) Interposer/Substrate method: The interposer or substrate provides the mechanical support and routing necessary for connecting the multiple chips. It may be made of silicon, glass, or organic materials and includes multiple layers for routing electrical signals. This will allow us to make our research test chips with high integration density and improved speed performance.
That is why we want to develop in our lab the flip-chip and system-in-package integration know-how.
Students task description
- Literature survey about the alternative approaches and service suppliers
- Develop a process to create gold bumps on a PCB/substrate/interposer.
- Develop a process to bond a chip on a substrate using the Dr. Tresky T-5300 machine.
- Design an interposer(s) that are (much) flatter than a PCB.
- Realize a demonstrator of the acquired know-how
Student task description for extension (if applicable)
- Iterate steps 4 and 5
- Define existing problems in the developed know-how and propose further steps for research
Initial Literature Review - done (including pdfs)
- DONE. At this link you find a nice overview of all the major interconnection techniques available to connect electrically dies and substrates. Remember you will go for bumps (thermal compression or ultrasonic bonding) + flip chip. Discusses bonding materials like gold/aluminium https://www.nextpcb.com/blog/wire-bonding
- DONE. How to make gold bumps? Check this .pdf file related to our machine. https://www.tpt.de/wp-content/uploads/00_Media/99_Elemente_und_Platzhalter/Anleitungen/TPT-Application-Bumps-NEW-EN.pdf and relative video https://www.youtube.com/watch?v=0-UblD-Tv1w
- DONE. Here a recent relevant paper about an application of the flip chip approach https://ieeexplore.ieee.org/stamp/stamp.jsp?tp=&arnumber=6848323A
- DONE. tutorial on the flip chip process step by step https://www.integra-tech.com/hubfs/INTEGRA%20Flip-chip-Tutorial-video-042021.pdf
- DONE. Broad-band interconnects up to 80 GHz and more realized slide deck over flip chip processes for mmWave applications https://ewh.ieee.org/r8/norway/ap-mtt/files/DML_Norwegen_2008_Handout.pdf
- DONE. Finally some info about interposers https://anysilicon.com/semipedia/interposer/
Prior Research Done in Project
Topic: Development and Characterization of Thermal Compression Flip-Chip Bonding Process.
The goal was interposer design & production, bump placement, die placement, testing. But only interposer design was achieved and bump placement on interposer.
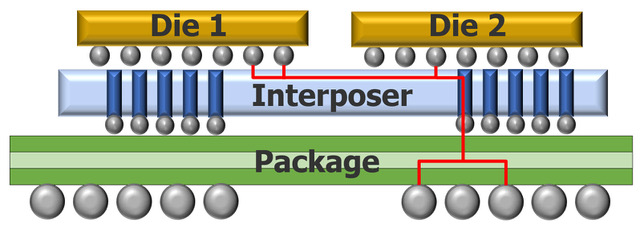
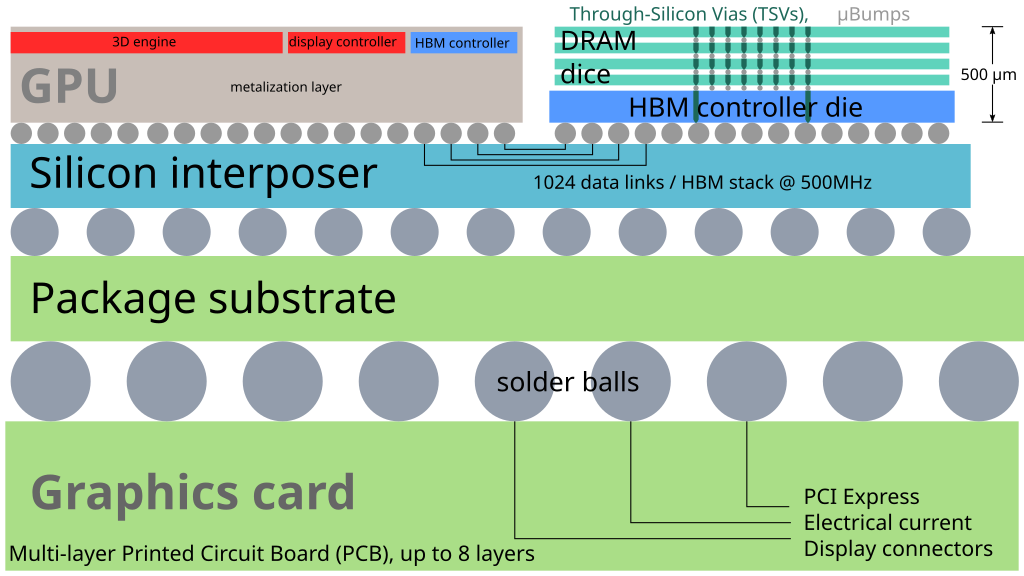
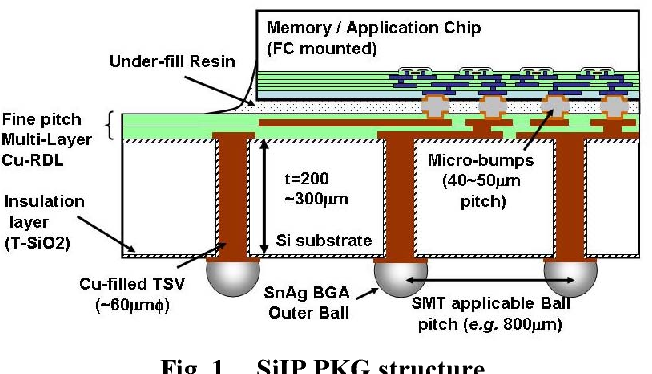
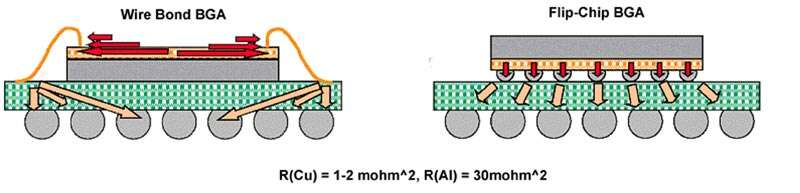
Connector ball pitch is the primary research constraint.
Interposer Design
Interposer design can be made either from silicon, glass or organic materials.
- Silicon: have great electrical performance and thermal conductivity. Uses through silicon vias (TSVs)
- Glass: high electrical resistivity, best for high frequency applications due to low dielectric loss
Interesting References:
TGV (Through glass vias)/ Interposers
Research on Methods of Depositing a Conductive Layer on Interposer
Metallization: Making Conductive Traces on Silicon Chips. - YouTube
DIY Physical Vapor Deposition (PVD) using Thermal Evaporation - YouTubeEtching: using strong acid to remove unprotected layer of metal to carve out specific design.
The 2 primary choices here were physical vapor deposition (PVD) based. Sputtering and Evaporation
There are other methods of PVD mentioned on the wikipedia page.
Interesting References:
- Wet Etched Silicon Interposer for the Connection of CMOS ICs and Optoelectronic Dies
- Etching (microfabrication) - Wikipedia
Wet Etching: Involves immersing the material in a liquid chemical etchant that dissolves the exposed areas.
Dry Etching: Employs gases or plasmas to etch the material, offering greater precision and control.PVD vs CVD: Mastering Advanced Thin Film Deposition Techniques
In general in the video of Metalization he explains the difference between an etching and lift-off method, an etching method applies photoresist on a metal layer and then using an etching solution the metal layer NOT covered by photoresist is removed and then the photoresists is removed to expose the metal pattern.
In our case though we focus on the lift off method (evaporation/sputtering as 2 available options), here the metal layer is deposited on top of photoresist and then the photoresists is removed and only the metal layer pattern remains.
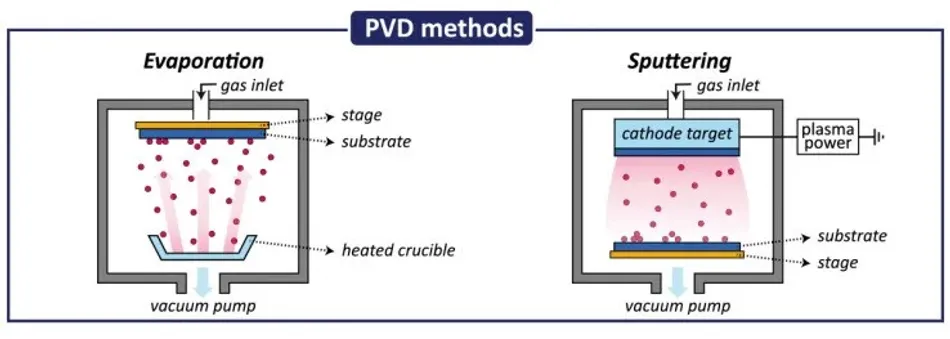
Sputtering vs Evaporation
Evaporation and sputtering are both physical vapor deposition (PVD) techniques, but differ in energy mechanisms, film properties, and adhesion.
1. Directionality & Step Coverage
- Evaporation is line-of-sight: atoms travel in straight paths.
- Sputtering involves energetic collisions → more isotropic deposition and better step coverage over features.
2. Adhesion (especially on glass)
- Sputtering often yields better adhesion due to:
- Higher energy of deposited atoms
- Substrate bombardment during growth
- Partial intermixing at interface
3. Film Density
- Sputtered films are generally denser and more uniform due to higher atom energies (
several eV). - Evaporated films can be porous or columnar due to low energy (
eV) atoms. 4. Deposition Rate & Uniformity
- Evaporation: high rate but poor uniformity across large substrates.
- Sputtering: lower rate but better uniformity.
5. Energy Considerations
- In sputtering, ions transfer momentum:
eV eV - In evaporation:
eV 6. Film Stress & Morphology (Thornton Diagram)
- Evaporation often leads to tensile stress and columnar growth.
- Sputtering can tailor compressive or tensile stress via parameters like pressure, bias, and temperature.
7. Material Suitability
- Evaporation struggles with compounds or high melting point materials.
- Sputtering allows stoichiometric transfer of complex targets.
Summary Formula (Mean Free Path λ):
- In high vacuum (evaporation),
is large → ballistic transport. - In sputtering (low vacuum), more collisions → diffusive paths.
Conclusion:
For high-quality metal films on glass substrates, sputtering generally provides superior adhesion, step coverage, uniformity, and film density — especially crucial for interposer fabrication and high-frequency applications.
Wafer and overall microelectronics die bonding methods: Wafer bonding - Wikipedia
- Thermal Compression Bonding
- Uses heat and force to connect the bumps.
- Relies on diffusion and mechanical interlocking.
- Requires precise temperature and pressure control to avoid damage.
- Commonly used in fine-pitch interconnects where high reliability is needed.
- Understanding Thermo-Compression Bonding | Cadence
- Eutectic bonding
- Utilizes an intermediate solder alloy to form a continuous bond.
- Requires precise composition (e.g., Au-Si, Au-Sn) to achieve eutectic melting.
- Used in die packaging for systems sensitive to [outgassing](https://en.wikipedia.org/wiki/Outgassing#:~:text=Outgassing%20(sometimes%20called%20offgassing%2C%20particularly,or%20absorbed%20in%20some%20material.) of standard die attach materials.
- Benefits: Strong, hermetic seal with good electrical conductivity.
- This method utilized in prior BEP, Ti adhesion layer gold bonding.
- Ultrasonic welding
- Employs high-frequency vibrations to bind surfaces.
- Reduces the temperature budget by utilizing localized friction at contact points.
- Suitable for delicate or heat-sensitive materials.
- Used in wire bonding and fine-pitch microelectronics assembly.
- Solder Bump Bonding
- Involves reflowing solder balls to create electrical and mechanical connections.
- Requires precise flux application and thermal profile to achieve good wetting.
- Common in flip-chip technology for high-density interconnects.
- Can support high-speed and high-power applications.
Ball Bump Placement
- Ball Bump Mode: Creates a bump with a tail that can potentially cause shorts during die placement. A coining tool can flatten the tails to reduce the risk of a short circuit being formed.
- Ball Wedge Mode: Cuts off the tail, leaving a well- rounded top, which is preferred to reduce short circuit risk.
For VNA (Vector Network Analyzer) on top of other methods explained the de-embedding method yields the most accurate result, and since we have access to a VNA machine in the lab, we can employ this method.
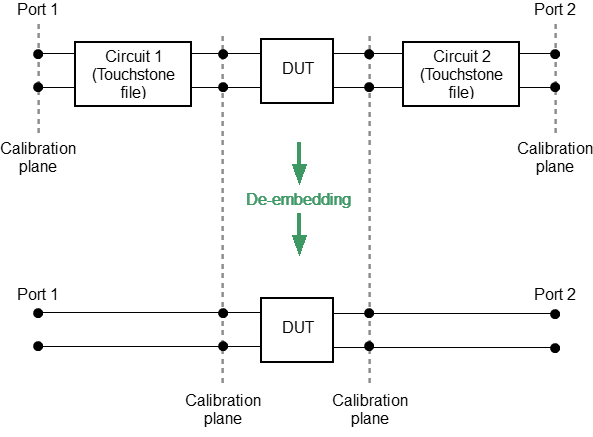
Understanding De-embedding - YouTube
A Visual Introduction to Scattering Parameters - YouTube
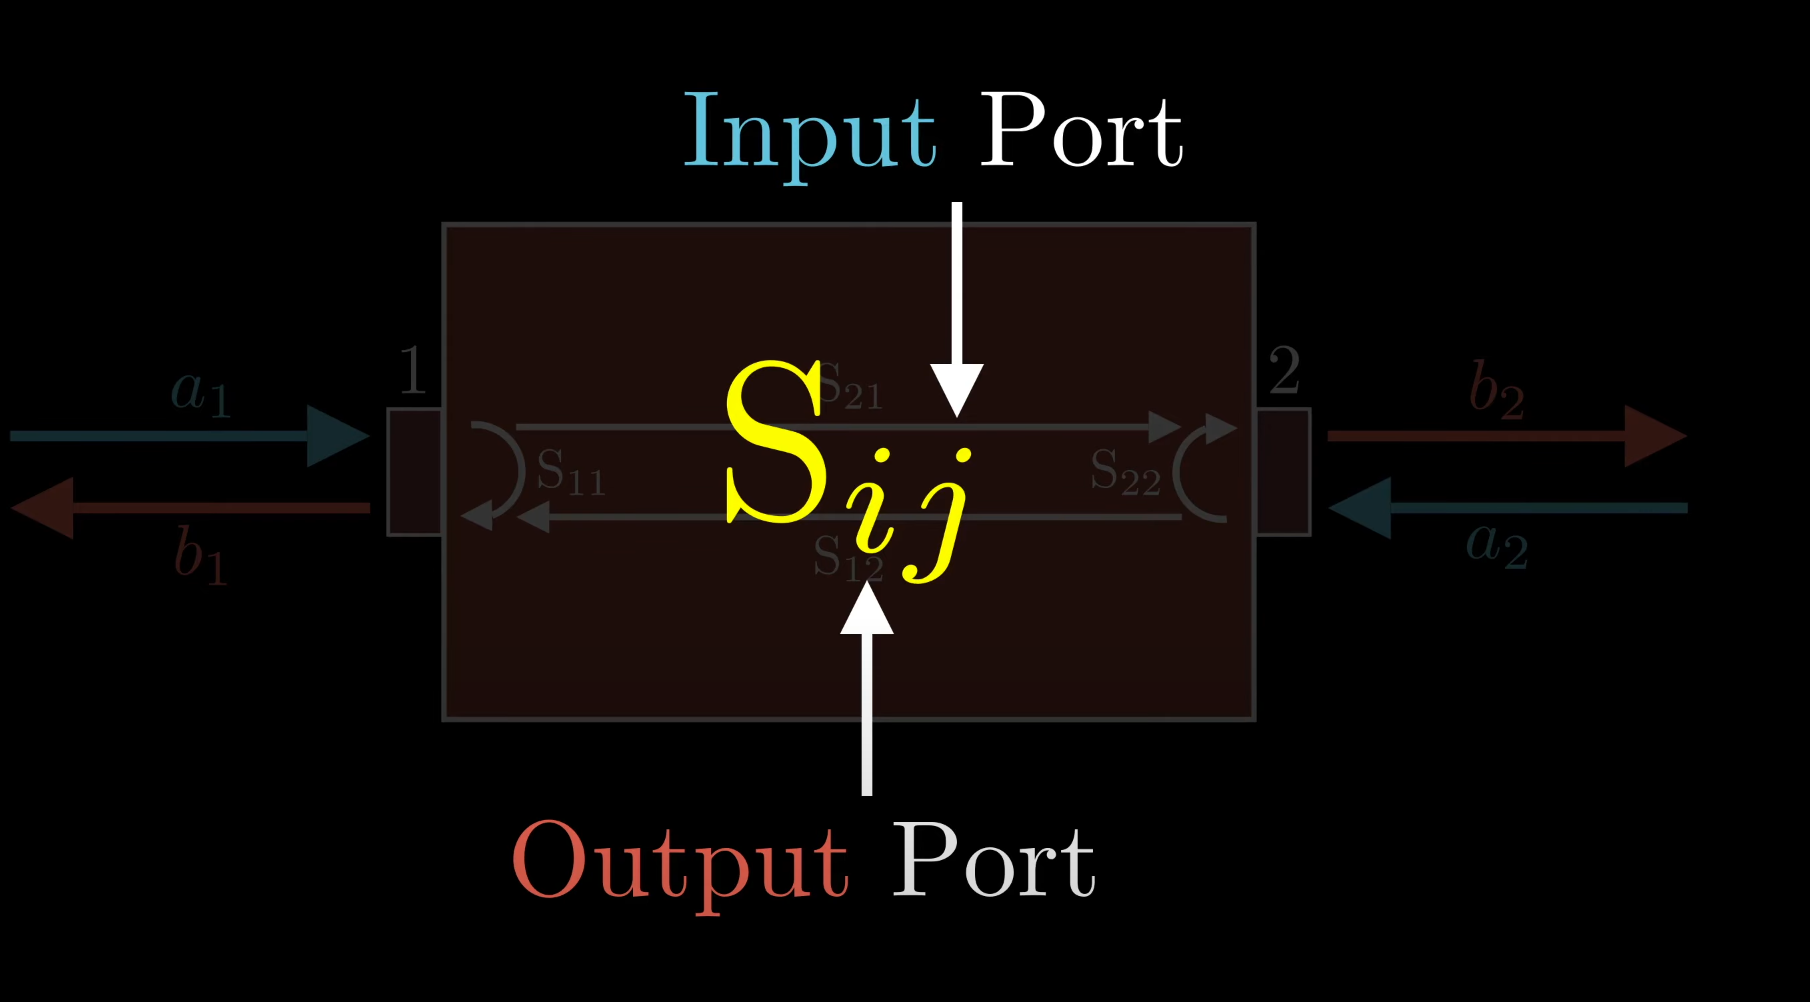
Fabrication Challenges & Findings
Eutectic bonding was employed with the standard, Ti adhesion layer and sputtering/evaporation based deposit of conductive layer. Primarly failed due to required thermal profile not being achieved.
Used Au instead of Cu → see research papers on why.
Design 1 and Design 3 were used for actual interposer testing they both were made in multiple batches some using evaporation and some using sputtering the paper mentions that the sputtering the interposers exhibited much higher resistivity due to more defects and having gassing effects present on the deposited layer.
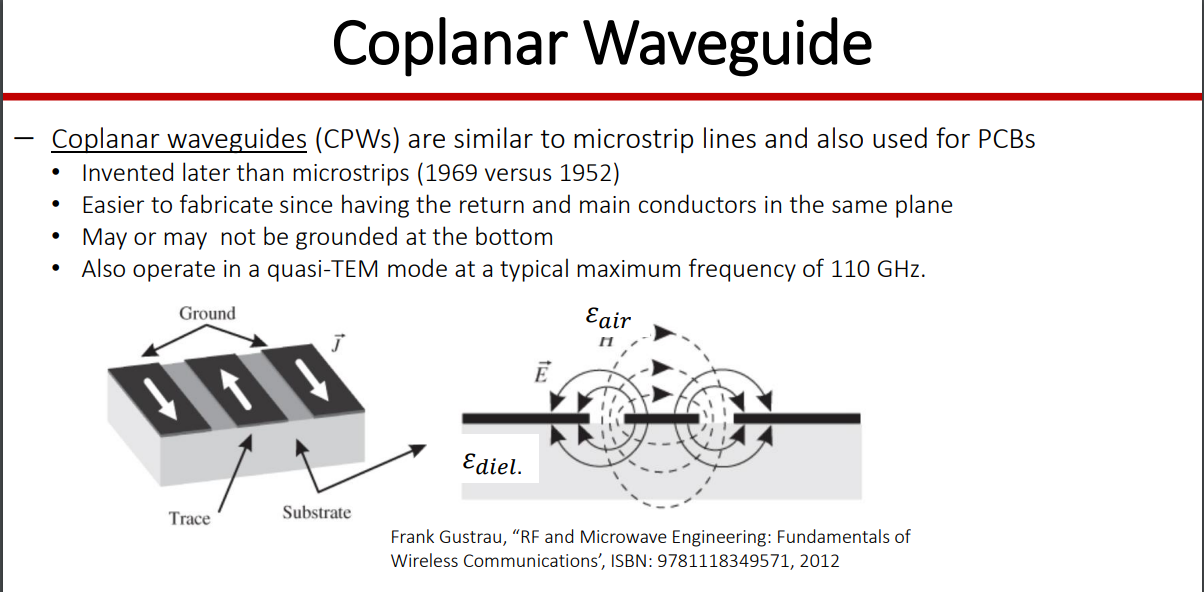
Design 2 was used for ground and open circuit testing. For example for line testing since the connecting wires of the interposer exhibiting characteristic impedance to find Coplanar waveguide.
On Design 2 gold bump placement were not gold bumps they were cone shaped deposits, due to increased amount of gold surface area that is used for ground plane.
There was a heating malfunction where the temperature went only to 270 degrees.
Biggest problem was yielding issues due to gold bumps of
The die placement was also an issue and broke overnight due to the mechanical stress due to ban interconnections.
Matlab code was used to find out the true size of gold bumps by identifying how they look and measuring in pixels and converting to micro meters.
Measurements Obtained & Calculated
Conversion Rate (CR) for Image Analysis:
Wavelength of Propagating Signal in Glass:
Line Impedance Calculation:
Trace Resistivity Calculation:
Sheet Resistance and Resistivity for Different Metallization Methods:
- Evaporation (batch 2):
Ω/square, S/m - Evaporation (batch 2):
Ω/square, S/m - Sputtering (batch 1):
Ω/square, S/m - Sputtering (batch 2):
Ω/square, S/m Resistivity Factor Compared to Pure Gold:
- Pure gold:
S/m - Evaporation samples: factors of 1.953 and 1.782
- Sputtering samples: factors of 2.461 and 2.454
Measured RLCG Values per µm for Evaporation Sample:
(Values plotted over 10 MHz - 10 GHz)
Fabrication Summary
1. Interposer Design & Production
- Glass interposer is used as the substrate.
- Metallization process:
- Titanium adhesion layer (50 nm) is first deposited to improve bonding between the glass and the conductive metal.
- Conductive metal layer (gold) is deposited on top of titanium.
- Two deposition methods tested:
- Sputtering – Higher resistance, less consistent bump placement.
- Evaporation – Preferred method due to lower resistance and more reliable bump placement.
2. Bump Placement
- Gold wire bumps are formed for electrical connections.
- Wire sizes tested:
- 25 µm wire: Most reliable, but requires a pad pitch > 90 µm.
- 17 µm wire: Good quality for small gold surfaces, but unreliable on large surfaces due to clogging.
- Placement method:
- Alignment is improved by using a cursor as a reference.
3. Die Placement
- Key optimization parameters:
- Heat profile, force, and duration must be tuned for a strong bond.
- Weight distribution is critical to ensure proper metal-to-metal contact.
- Challenges:
- Initial attempts were semi-successful due to difficulties in heat profile settings.
4. Testing & Characterization
- Performed in:
- Cleanroom (for fabrication control).
- Electronics lab (for electrical measurements).
- Further optimization required:
- Improving bump and die placement settings.
- Investigating AC behavior of interposer tracks at frequencies > 10 GHz.
- Exploring electrical characteristics of the bumps.
Known Dimensions from Prior Research
- Gold wire diameters tested:
and - Bump diameter for 25μm wire:
(expected: wire diameter) - Pad pitch size:
(requires increase to for 25μm wire) - Pad size and spacing (Design 1):
pad, spacing - Pad size and spacing (Designs 2 & 3):
pad, spacing - Trace width: Matches pad size
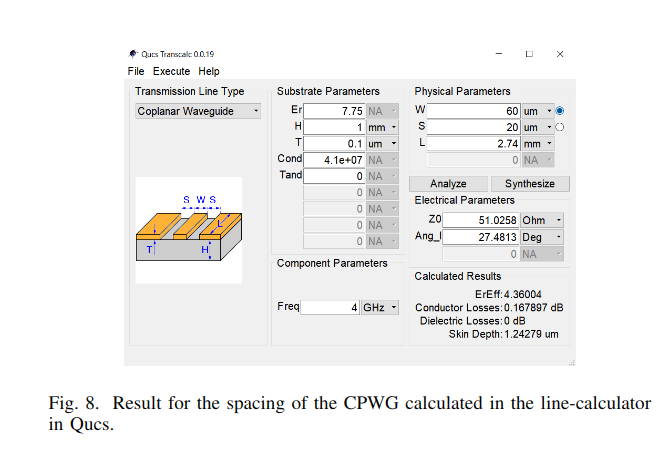
- CPWG spacing (Design 2):
- Electrode thickness (Batch 1):
- Electrode thickness (Batches 2 & 3):
- Measured gold thickness (Batch 1 samples):
and - Die size:
(measured as ) - Camera pixel-to-metric conversion rate:
- Transmission line lengths measured:
, , , and - Relative permittivity of glass substrate:
- Wavelength at 10 MHz:
- Gold resistivity (reference):
- Trace resistivity (Evaporation):
and - Trace resistivity (Sputtering):
and - Line impedance formula:
- Trace resistivity formula:
Basic Definitions for Quick Reference and to Check Later
-
Comparison of 2.5D TSV based assembly options: A closer look
-
Gold Stud Bump Flip Chip Bonding on Molded Interconnect Devices
-
Performance and Process Comparison between Glass and Si Interposer for 3D-IC Integration
-
Solid Logic Technology: Versatile, High-Performance Microelectronics*
-
Sapphire flip-chip thermocompression and eutectic bonding for dielectric laser accelerator
-
S-Parameter-Based IC Interconnect Transmission Line Characterization
-
A Comparison of Electrical Performance between a Wire Bonded and a Flip Chip CSP Package
-
Study of Gold Wire Bonding on 0.1 ȝm Soft Gold Film Substrate
-
Gold Stud Bump Flip Chip Bonding on Molded Interconnect Devices
-
Comparative Analysis of Electrical Performance on Coreless and Standard Flip-Chip Substrate
-
A High Throughput and Reliable Thermal Compression Bonding Process for Advanced Interconnections
-
MATLAB - Measuring Manufacturing Yield for Gold Bumping Processes Under Dynamic Variance Change
BEP Research
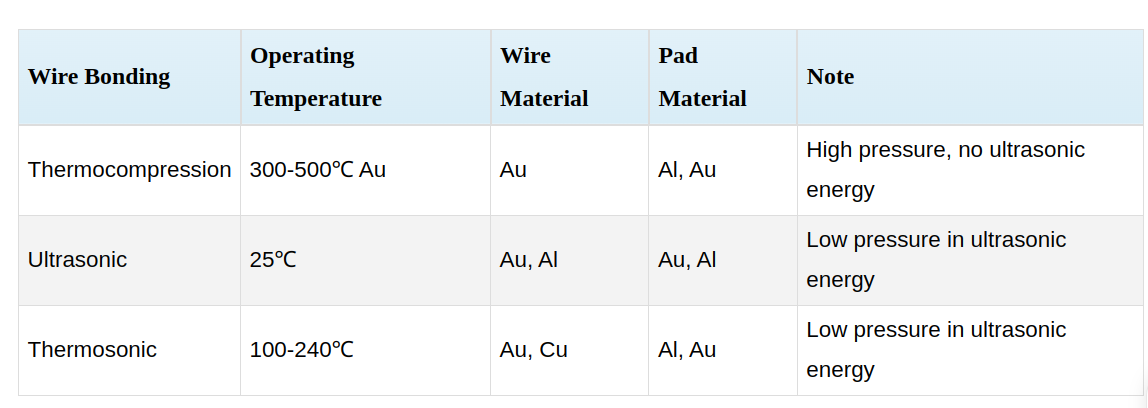
Bonding Material (Why Gold?)
- conductivity, corrosion resistance, capacity to get bonds in place in an ambient environment.
- copper oxidizes easily.
- Bump bonding
explore the idea of bump to pillar bonding techniques.
Everything to consider during bonding
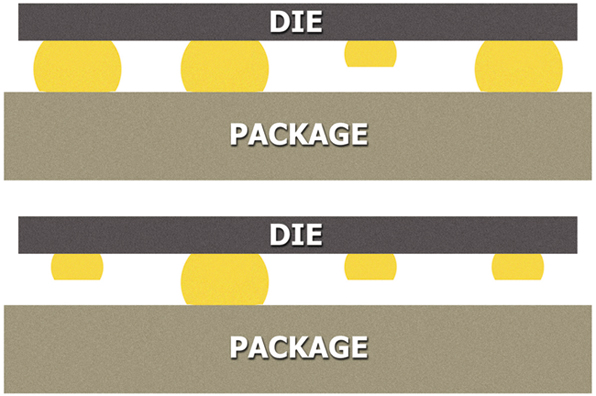
planarity, in flip-chip bonding, refers to the height consistency
interposer design patterns.pdf
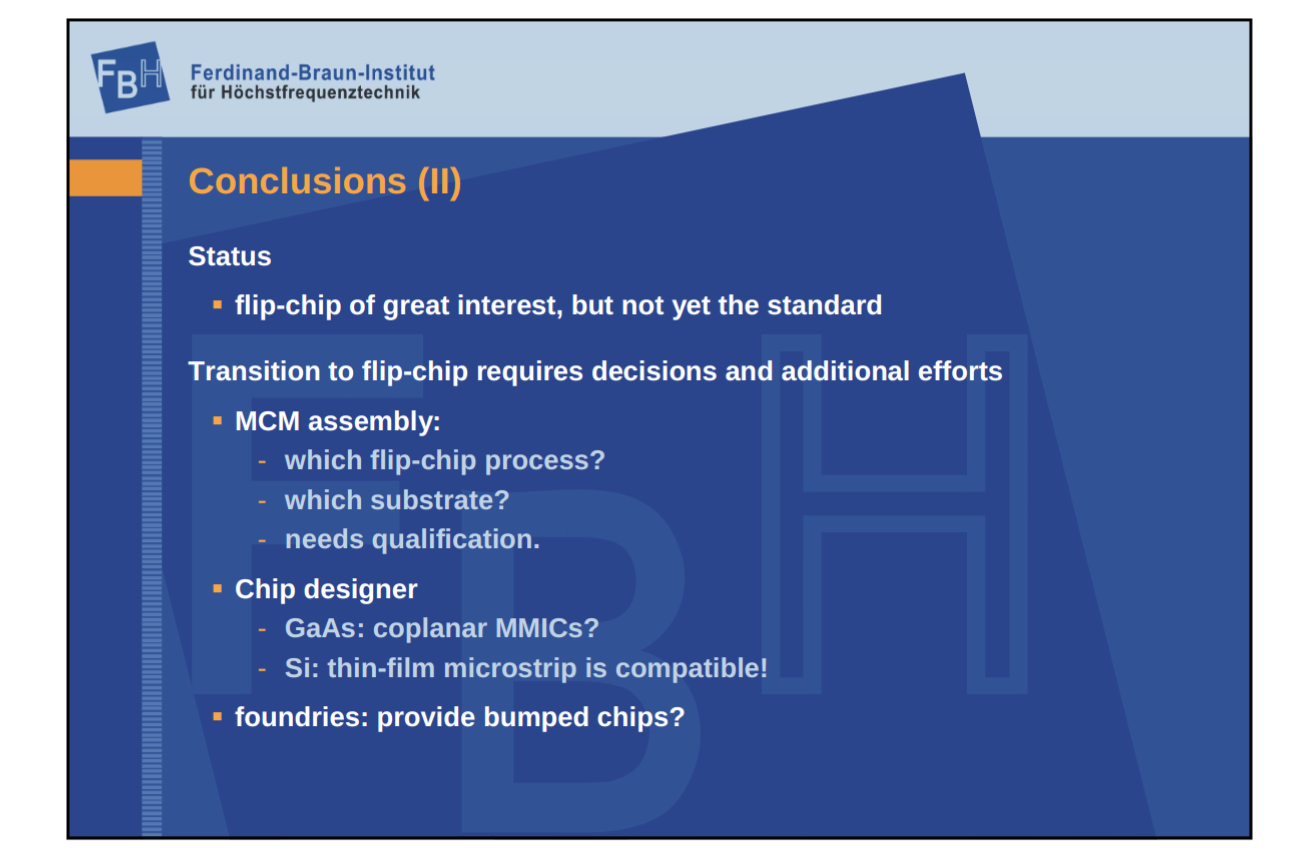
PARALLEL PLATE LINE (UNDERSTAND)
thin film microstrip on carrier
Interconnection signal property details
Planar transmission line - Wikipedia
Advantages of Flip chip
- high pin count
- high signal density
- better power dissipation
- low signal inductance and good power/ground connectivity
- ideal for high speed interfaces (including RF) that wire bonds cannot support
- good assembly dynamics
- FCBGA (flip chip ball grid array): good thermal performance, finer pitch routing, preferred for high power design (look into power amplification chips).
- best for lower frequencies due to short interconnections
- suitable for mm-waves because of small dimensions
- RF-effects: detuning of on-chip circuit, reflections at bump transition.
- Broad-band interconnects up to 80 GHz and more realized
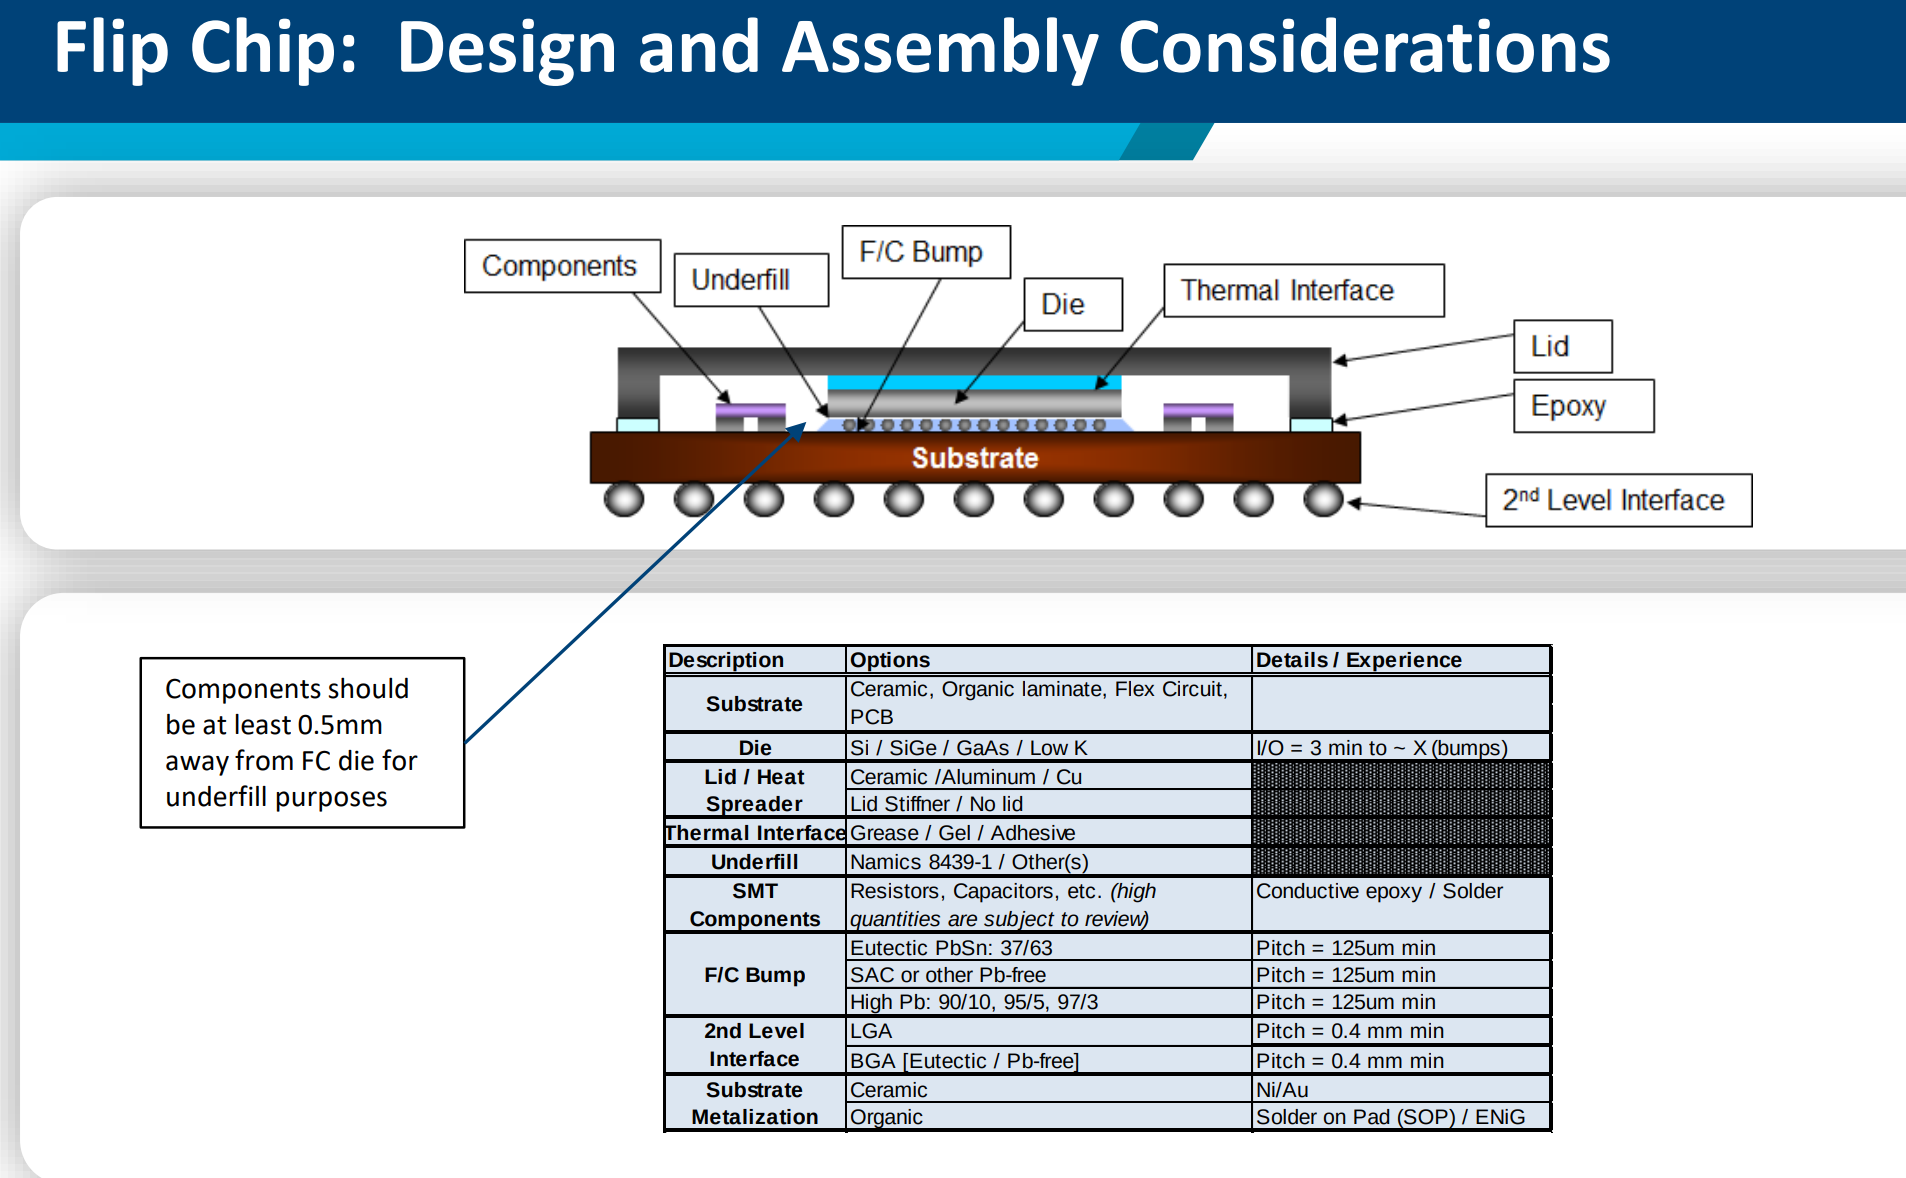
Advantages of Interposer
- higher interconnect density
- iimproved signal integrity
- lower power consumption
- enhanced power efficiency
- potential for cost savings in manufacturing processes
- primary reason is fro RDL (redistribution layers) → reroute connects from dense pitch to wider pitch of substrate.
- look into Intel embedde multi-die interconnect bridge (EMIB)
Reliability of Silver Wire Bonds:
Formulas
Acceleration Factor (Peck’s Model)
Mean Time To Failure (MTTF)
Failure Criterion
A chip is considered failed if its resistance increases by. Material Properties
Silver (Ag):
Thermal conductivity:
Electrical resistivity:
Young’s modulus:
Vickers hardness:
Price:19.59/\mathrm{oz}$ Gold (Au):
Thermal conductivity:
Electrical resistivity:
Young’s modulus:
Vickers hardness:
Price:1322.10/\mathrm{oz}$ Copper (Cu):
Thermal conductivity:
Electrical resistivity:
Young’s modulus:
Vickers hardness:
Price:0.14/\mathrm{oz}$ Testing Conditions
- HTST:
- Biased HTST:
- u-THS:
RH - b-THS:
RH, Experimental Insights
- Silver wire bonds have MTTFs:
Type 6:years
Type 7:years - Gold wire bonds: No failure observed in test period
- Acceleration Factor computed:
[!NOTE] Ball Bonding Material RecommendationRecommended Material: Gold (Au)
Gold remains the best choice for ball bonding between chip and interposer due to its proven long-term reliability. In accelerated stress testing, no gold wire bond failures were observed, while silver showed failures under bias, humidity, and temperature conditions.Why Material Properties Matter in Ball Bonding
- Thermal Conductivity (
): Measures how well heat dissipates. Important to prevent thermal buildup at the bond interface. - Electrical Resistivity (
): Lower is better for signal integrity and power efficiency. - Young’s Modulus (
): Reflects stiffness. Lower modulus (as in gold) allows better compliance with thermal expansion, reducing stress and cracking. - Vickers Hardness (
): Indicates material hardness. Too hard (like copper) risks damaging bonding pads; too soft (like silver) risks deformation and reliability loss. Gold offers the best balance of these properties, making it ideal for reliable, damage-free, and high-performance ball bonds in microelectronics.
Types of Interposer
Open Test Structure
• Purpose: Baseline measurement of parasitics (pads, traces) without loading
• Use for: De-embedding using open reference
• S-parameter setup: Port to open-end
• Key idea: Used to extract pad capacitance and stray inductance
• Example use: OS (Open-Short) de-embeddingShort Test Structure
• Purpose: Estimate inductive and resistive components of interconnects
• Use for: De-embedding with shorted reference
• S-parameter setup: Port to GND short
• Key idea: Combined with open test to isolate bump resistance/inductance
• De-embedding equation:Through-Line (Matched Line)
• Purpose: Measure the characteristics of a transmission line
• Use for: Extracting, , , per unit length
• S-parameter setup:for insertion loss, for reflections
• Length examples:
• Equation:Open Bump Chain
• Purpose: Evaluate parasitics of bump-only interconnects
• Use for: Modeling bump resistance and inductance
• S-parameter setup: End left floating
• Key idea: Useful to isolate bump contribution from trace contributionTerminated (Load-Matched)
• Purpose: Validate impedance matching
• Use for: Reflection coefficient, return loss
• Termination: Load with
• Key metric:if matched properly Loopback Interposer
• Purpose: Simple continuity and total path loss check
• Use for: Insertion loss test, system-level check
• Setup: Connect input pad directly to output pad via traceMulti-Length Line Structures
• Purpose: Characterize delay and extract RLCG via linear fitting
• Use for: Time delay, slope-based parameter extraction
• Length variation:
• Key formula:Coplanar Waveguide (CPWG)
• Purpose: Validate controlled impedance trace layout
• Use for: High-frequency signal propagation
• Design goal:
• Tools: Qucs, LineCalc, or ADS to design with, , , Die Bonded Structure
• Purpose: Final test including actual bonded die
• Use for: Validating electrical contact and full signal chain
• S-parameter setup: VNA probes on die I/O or breakout pads
• Note: Only used after confirming open/short/through integrity
Practical, Theory & Lab-Execution Plan
Simulations & Formulas
1. Gold Bump Lump Model (S1P)
Relevant Paper
S-parameter extracted from simulated lumped models of a GSG CPW line of below dimensions (Length: 1.5mm, Signal line width: 69 microns, Ground line width: 153 microns). The goal is to first use the VNA machine to calibrate for measuring the RF TXFE die and extracting the 1 port S parameters directly from it. Since the die is already on a PCB the calibration happens using a PCB without the die but just with a substrate. The second step is to calibrate and extract the 1 port S parameters from the interposer, specifically of the dimensions previously mentioned of the GSG CPW lines, the goal is to calibrate with an open and a short. The 3rd step is to place the gold bumps on the interposer and then perform a successful flip chip of the RF die onto the interposer with a successful bonding achieved a DC measurement will happen which will confirm the connection and then we will perform the VNA the 1 port s parameter extraction of the full interconnected system. We then perform de-embedding in MATLAB and by subtracting the S parameters of the die and substrate from the full system, achieve the S parameters of the gold bump which can be used to determine the R or RC lump model of the gold bump.
After the first step the goal is to also perform QUCS simulations based on the S parameters from the die and calculated lumped components of the gold bump and the interposer GSG lines and compare them with reality. We will use a 1 port file from the die in the qucs simulation and the calculated estimated lump model of the bump and the line.
The practical experiement:
- probe chip,
. - probe the open and short GSG lines of the interposers, calculate the reference plain at transmission line end.
- probe the chip + interposer + gold bumps (connecting the interposer to die) on the GSG lines.
- Use de-embedding to extract the S-parameters and then the lump model of the gold bumps by subtrsating from the full system in step 3 the step 1 and 2 of the die and interposer.
- (all of the above is done as a 1 port system).
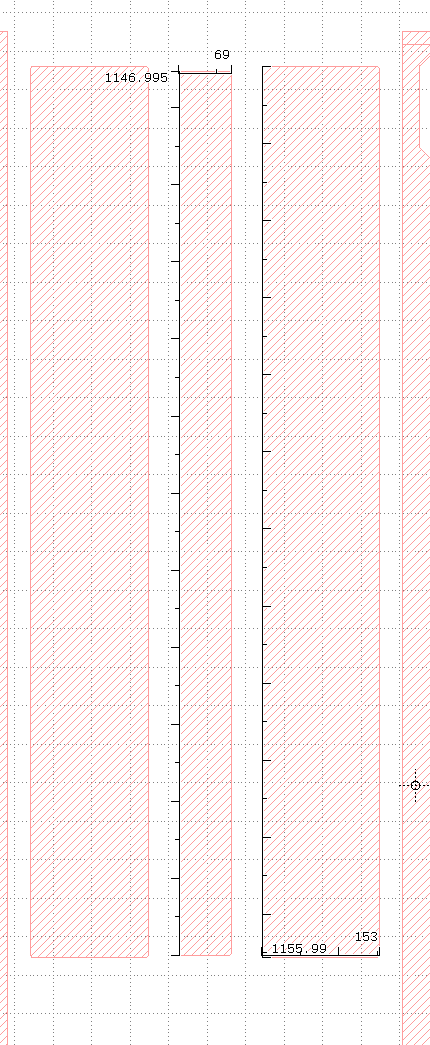
Lump Model of the GSG Lines (Simulation) — R L C G view @ 10 MHz
Symbols & Geometry
| Symbol | Meaning | Value |
|---|---|---|
| Signal-strip width | 69 µm | |
| Gap (signal ↔ ground) | 41 µm | |
| Ground-bar width | 153 µm | |
| Metal thickness | 150 nm (Ti/Au) | |
| Measured resistivity | ||
| Substrate permittivity | 7.75 (glass) | |
| Loss tangent | 0.005 | |
| Physical length | 1.15 mm | |
Effective permittivity (thick-substrate, quasi-TEM):
Closed-form R L C G formulas
Per-unit-length results @ 10 MHz (per µm, SI units)
| Parameter | Value | Unit |
|---|---|---|
Lumped
| Element | Formula | Value |
|---|---|---|
| 5.54 Ω | ||
| 0.486 nH | ||
| 66.1 fF | ||
| 24.1 MΩ | ||
| (pad-to-pad) | 0 pF |
QUCS setup
| Element | Value |
|---|---|
| Series | 5.54 Ω |
| Series | 0.486 nH |
| Shunt | 66.1 fF |
| Shunt | 66.1 fF |
| Shunt | 24.1 MΩ |
| Sweep | 10 MHz → 10 GHz, 10 MHz step |
Lump Model of the 3 bumps — one per line on (GSG) lines (Simulation)
The practical one-port measurement loop contains one signal bump in series and two identical ground bumps in parallel. Internally on the die the 2 ground pads are shorted and the signal pad is connected to one of the ground pads through an inductor.
The resulting lumped impedance is therefore:
1 Bump geometry
| Parameter | Symbol | Value | Notes |
|---|---|---|---|
| Free-air ball diameter | 70 µm | After EFO | |
| Compressed bump height | 25 µm | Final bonded height | |
| Contact diameter | 70 µm | Assumed same as ball | |
| Bump radius | 35 µm |
2 Lumped-element formulas for the 3-bump model
3 Numerical values (3 bumps combined)
| Element | Formula | Value |
|---|---|---|
| 0.24 mΩ | ||
| 96 pH | ||
| 3.6 fF |
4 QUCS implementation
Use one series branch with
mΩ pH
and one shunt capacitor to ground
fF
between the centre node and the reference plane in your one-port schematic.
2. Yield Testing
Report on showcasing the figures of the expected procedure during the experimentation in the lab phase.
3. Amplifier Performance Testing (Simulation)
Values were used to create an interposer mask, and also to choose the passive components that will be used on the interposer when fabricated.
Bias at: Vds=Vdd=28V, Ids=128mA bias, Vgs = -2.8V
Passive Component Table
| Ref | Value / Rating | Pkg |
|---|---|---|
| RS | 22 Ω, 0.333 W | 0603 |
| RD | 18 Ω, 0.333 W (optional) | 0603 |
| R1 | 10 MΩ, 0.1 W | 0603 |
| R2 | 1 MΩ, 0.1 W | 0603 |
| C1, C2, C3 | 100 pF, 50 V, NP0 | 0402 |
| Lbias | 4.7 µH, Isat = 620 mA | 0603 |
Design Calculations and Formulas
| Quantity | Formula | Inputs | Result / Value |
|---|---|---|---|
| RS | 2.8 V / 0.128 A | 21.9 Ω → 22 Ω | |
| Power in RS | 0.36 W | ||
| RD (optional) | (32 V–30 V) / 0.128 A | 15.6 Ω → 18 Ω | |
| Power in RD | 0.30 W | ||
| Gate bias | 28 V, 10 MΩ / 1 MΩ | 2.55 V | |
| 2.55 V − 0.128 A × 22 Ω | ≈ −0.27 V | ||
| Lbias head-room | 0.256 A |
We have 2 simulation types we have one qucs simulation using the provided amplifier transistor S2P file which is probed and direct S-parameters are extracted that showcase the 5 GHz S21 amplification are around 10.4 dB and with the transistor die on the interposer with the passive components create a common source amplifier with around 8.5 dB at 5GHz which showcases a good design of an interposer.
The transistor will be flip chipped onto the interposer and then since the gate pad is on the top the gate will be wire bonded after the flip chip. We are using the TGF-2023-2-02 transistor.
Types of Experiments (In order)
1. RF - Gold Bump Lump Model (S1P)
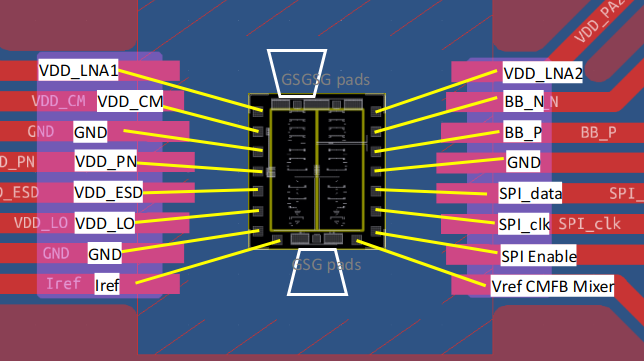
VNA Settings
- Frequency span 10 MHz→10 GHz, 10 MHz step
- Port impedance 50 Ω
- File format Touchstone .s1p
- we will use Keysight PNA-X N5247B
Step-by-Step Procedure
The first goal is to measure the s1p of the die directly, since the die is mounted on a pcb calibration of the vna was done based on open-short measurements on a special pcb wich only contained the substrate that is equivelant the one the die. After the calibration was done the die will be measured and the S1P data will be obtained.
The next step is to measure the open-short of the interposer GSG lines developed for this die to be flip chipped onto, after the s1p are measured there.
The next step is to measure the final DUT system of the die flip chipped onto the interposer which contained gold bumps, so the measurement would obtain the S1P of gold bumps, GSG lines and the die.
After the s1p files of these are obtained we move to making matlab simulations and doing a DUT comparison of qucs simulation to this.
2. Yield Testing
The goal is to perform a successful flip chip with a fake glass die onto a glass substrate which if successful would cause a short between the 2 ends of the interposer lines. During the process of adding gold bumps on the interposer we perform the first evaluation of the amount of successful gold bumps based on the developed thermal profile, then we also observe where the interposer conductive layers were damaged during the fabrication process these we discard from the 24 lines to evaluate, finally after a flip chip we check any visual problems caused to account for, for instance a short caused between a bump which had a very long tail. Then we perform a continuity test to ensure that that there is a short between the 2 ends of the row of the line and due to bump size there wasnt a caused an issue where due to one bump being bigger than the neighbour it caused the smaller one not to connect, lastly we form a short test between the 2 neighbour bumps in a column to confirm that during flip chip there were no shorts caused in that case.
3. Amplifier Performance Testing (s2p) (Practical) (just theoretical appraoch not in practice implemented for this research)
Amplifier Die
28V voltage bias, S parameter extraction at 2 ports to verify against simulation for 10MHZ to 5GHz in 10MHz step.
Bias at: Vds=Vdd=28V, Ids=128mA bias, Vgs = -2.8V.
SMD component adding performing a ball bonding flip chip and then wire bonding for the ground pad → complex operation. Then extracting the S parameters and comparing with the S parameters in the QUCS simulation, as well as comparing it with the BEST direct die transistor S parameters, to really evaluate the quality of the interposer and ability of creating a fully functional transistor amplifier circuit on an interposer (common source amplifier SiP).
Gold Bump Bonding Profile (TPT HB16)
The goal is to have 2 thermalsonic bonding profiles of creating gold bumps. One from acceleronix and one personally made based off calculations from the substrate.
Wire bonder TPT HB 16 (WIRE-BONDER)
Up CO: After the second bond, the clamp is opened, and the bondhead (Z-axis) moves upward, thereby cutting the wire.
Bump without Tail:
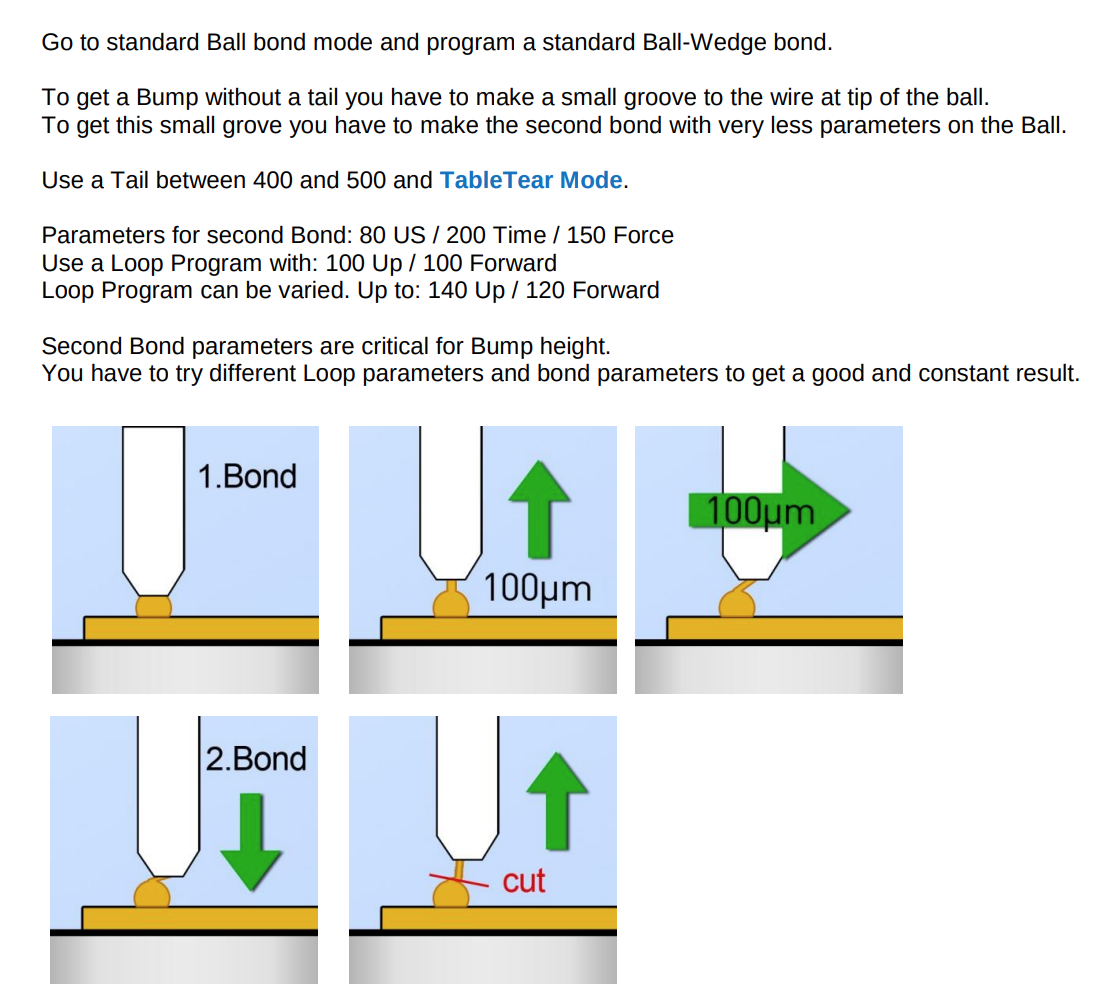
Calculated (Ballbond)
Bond 1
US(mW): 180
Time(ms): 150
Force(mN): 100
Bond 2
US(mW): 60
Time(ms): 60
Force(mN): 35
Other
YWay(
Looph(
Heater(
Tail Step(
EFO Power(mW): 90
Up CO(clamp open and bondhead move upwards): 300
Changed Parameters with Justification
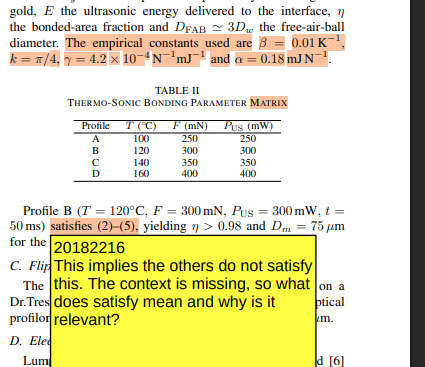
Based on interposer stack: Ti (50 nm) / Au (100 nm) on glass, 25 µm Au wire, HB-16 Wire Bonder.
| Parameter | Calculated | Calculation |
|---|---|---|
| 1st Bond Force | 100 mN | |
| 1st Bond Power | 180 mW | |
| 1st Bond Time | 150 ms | |
| Chuck Temperature | 120 °C | |
| Y-Way (Forward) | 120 µm | Manually aligned to centre on mashed bump crown after BOND1 |
| Looph (Up) | 120 µm | Set to ensure loop height ~120 µm, ensuring 2nd bond head clears FAB |
| Tail Length | 100 µm (×4 = 400) | Press tail 4× at 100 µm to create standard 400 µm tail for table-tear |
| 2nd Bond Force | 35 mN | |
| 2nd Bond Power/Time | 60 mW / 60 ms | |
| Up CO | 300 µm | Default lift height—ensures safe clamp lift after tail break |
Summary of Targeted Design
- Goal: Minimize ultrasonic energy and force to protect thin Ti/Au on glass.
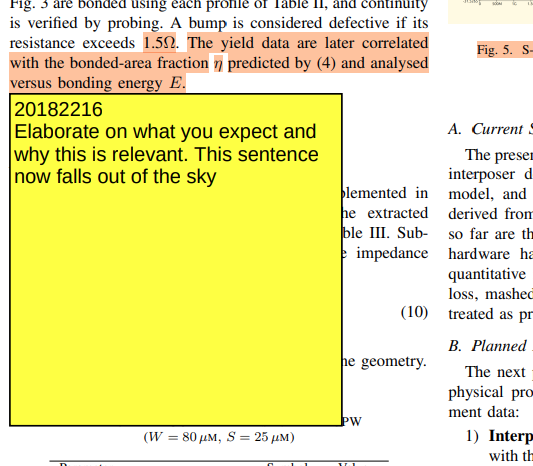
- Result: 27 mJ bonding energy at 100 mN yields ≥98% bonded area per slip-energy model.
- Equations Used:
equations in detail
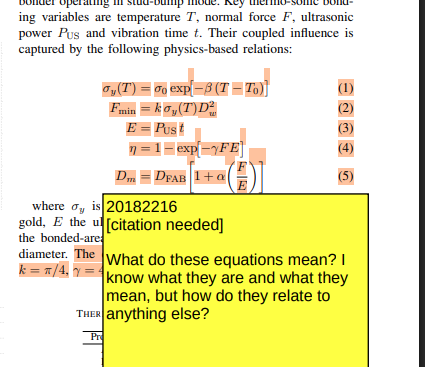
Key Equations for Optimising Gold Stud Bump Bonding
All symbols are defined immediately below each formula. These equations link the controllable bonder parameters (
) to bump quality metrics (bond coverage, diameter, strength) and enable predictive optimisation for any wire diameter or substrate stack. 1. Temperature-dependent yield strength
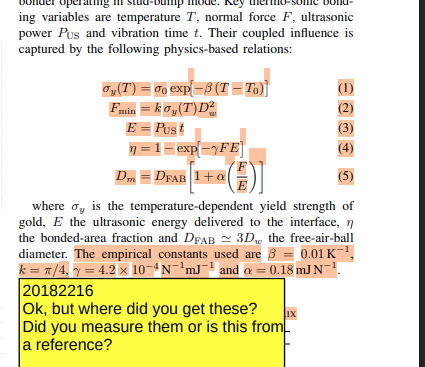
– yield strength of gold at temperature – yield strength at reference temperature – empirical softening coefficient (≈ 0.01 K⁻¹) – chuck / pad temperature (°C) – reference temperature (°C) 2. Minimum normal force for plastic flattening
– least force that initiates plastic flow – geometric constant for a hemispherical free-air ball (≈ π/4) – yield strength from Eq 1 – wire diameter 3. Ultrasonic energy delivered
– ultrasonic energy coupled into the interface – ultrasonic power set on the bonder – ultrasonic vibration time 4. Fraction of bonded area (slip-energy model)
– bonded-area fraction ( ⇒ full interface) – empirical constant ( mJ⁻¹ N⁻¹ for 25 µm Au) – applied normal force – ultrasonic energy from Eq 3 5. Minimum energy for ≥ 98 % coverage
– least energy that yields – as defined in Eq 4 6. Mash-diameter growth with excess energy/force
– final (mashed) bump diameter – free-air-ball diameter (≈ 3 ) – deformation coefficient (0.18 mJ N⁻¹ for 25 µm Au) – force and energy from Eqs 2 & 3 7. Cycle-time relation (chosen set-point)
– ultrasonic time required when power is fixed – energy from Eq 5 – ultrasonic power
Final thermal most successful thermal profile after multiple practical experiments ended up being:
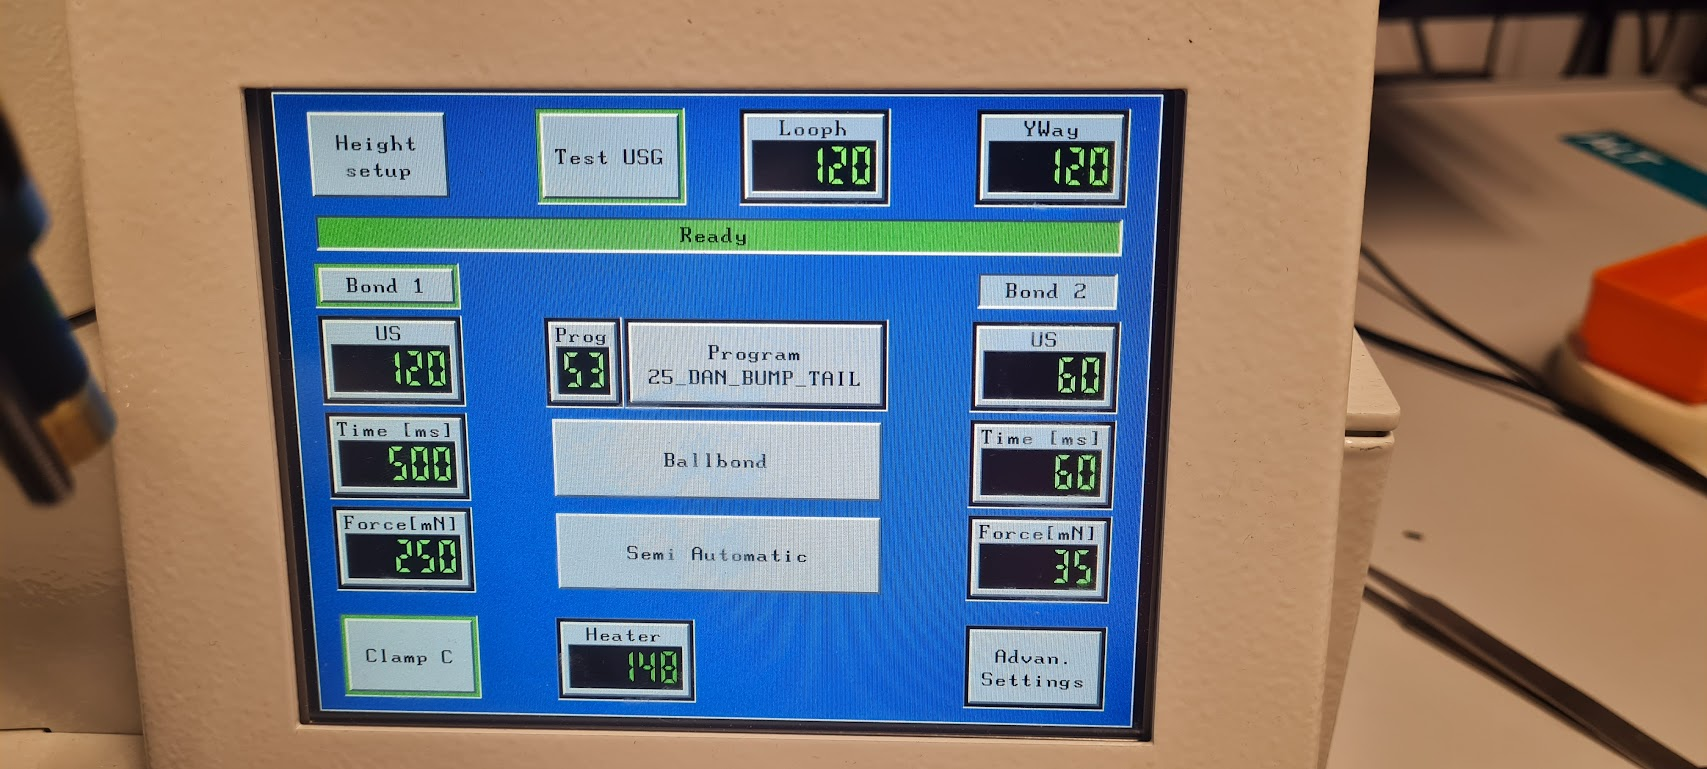
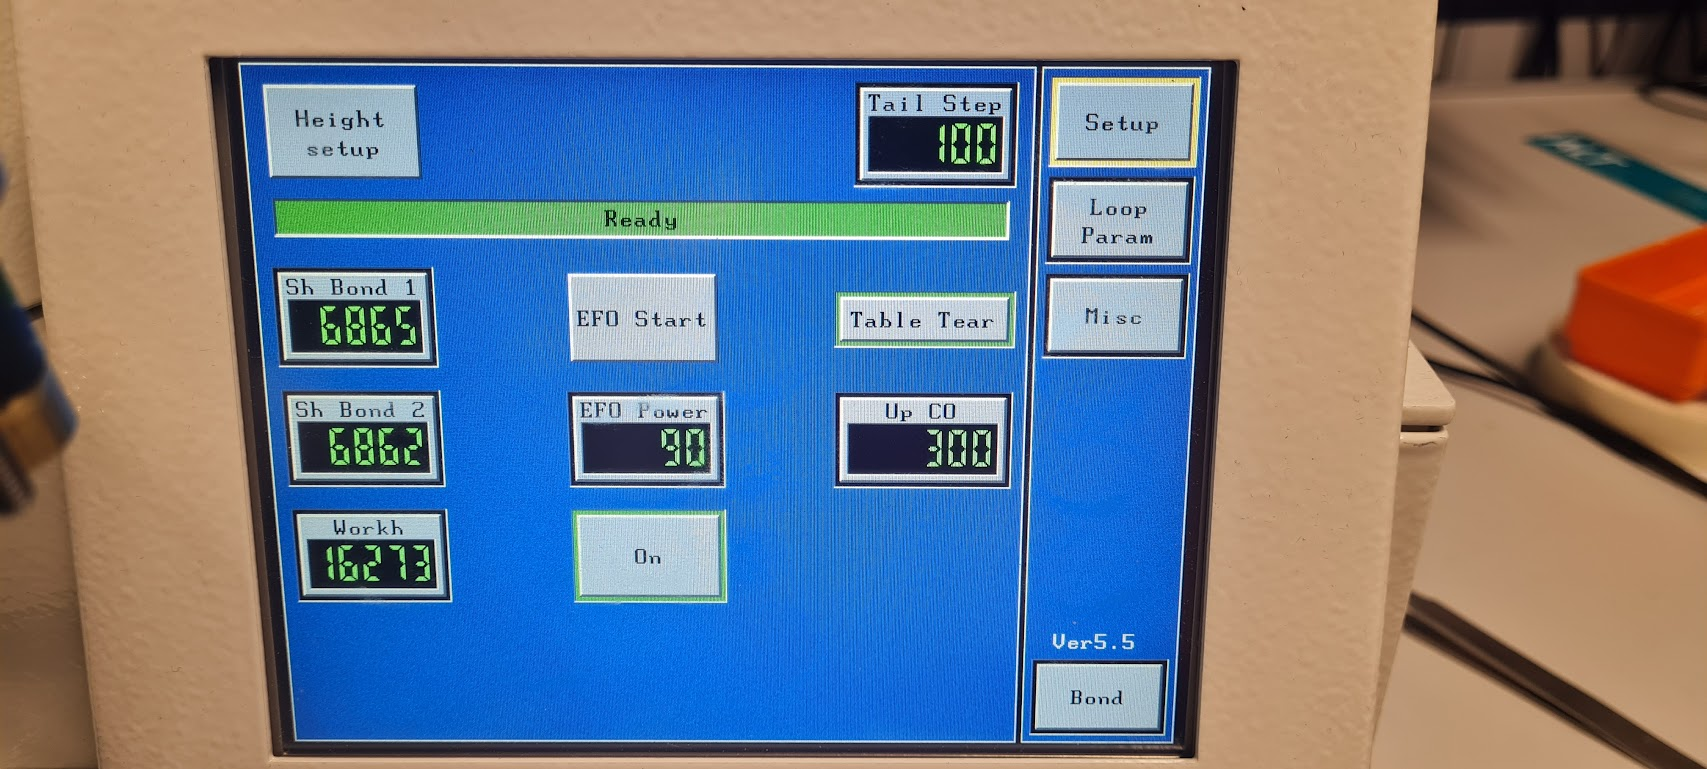
Where the changes were:
Temperature increased to 150 degrees, force of the first bond increased to 250mN, and the time of the first bond increased to 500ms.
Flip chip Bonding Profile (Dr. Tretsky T-5300)
The goal is to have 1 personally made bonding pressure and thermal changing profile for creating a successful flip chip.
| Parameter | Value |
|---|---|
| Place Force | |
| Interface Pressure | |
| Place Duration | |
| Diffusion Length | |
| 75/2 = 37.5 |
substrate
| Stage | Segment Type | Start Trigger | Start Delay [ms] | Duration [ms] | Ramp [ | Target Temp [ | Wait for Completion | Wait Target | Logic |
|---|---|---|---|---|---|---|---|---|---|
| Stage 1 | Heat | – | 0 | 30000 | No | – | – | ||
| Stage 2 | Heat | – | 0 | 15000 | No | – | – | ||
| Stage 3 | Heat | Wait for Touchdown | 0 | 10000 | No | – | – | ||
| Stage 4 | Heat | Wait for Touchdown | 0 | 60000 | Yes | Apply place force | PRE_EXEC | ||
| Stage 5 | Cooling | – | 0 | 30000 | Yes | – | SKIP_EXEC |
The final thermal profile during experimentation ended being the ones shown in the picture, where 2 more stages were added to progressively add the temperature even better, before moving to touch down the heating stabilizes at 250 degrees and then during touch down it increases to 300 degrees and as soon as touch down happens it is increases to 350 degrees to have maximal coining.
During yield testing the pressure was also lowered to 20 grams per bump instead of 35 as the too high pressure caused observant sliding where even when the samples were well aligned on the beamsplitter after the processes a notable sliding took place where the fake die evidently slid off the target bump spots.
Actual Data
deembedding gold bump
rlcg of line
RLCG model graphs were obtained to represent the measurements
rlc of bump
plots of RLC were obtained and the concluded relevant lump model of 1 gold bump is
note
the obtained value at 10MHz was
When referring to lines I mean the GSG lines, and when to bumps there are 3 bumps on the end of the GSG on each line there is 1 bump.
And since we want the lump model of 1 gold bump we do:
Showcasing a quick way to find out the results at low frequency.
Other calculations
For the direct current resistance one of the ground lines was chosen as test subject.
GSG line params:
yield testing
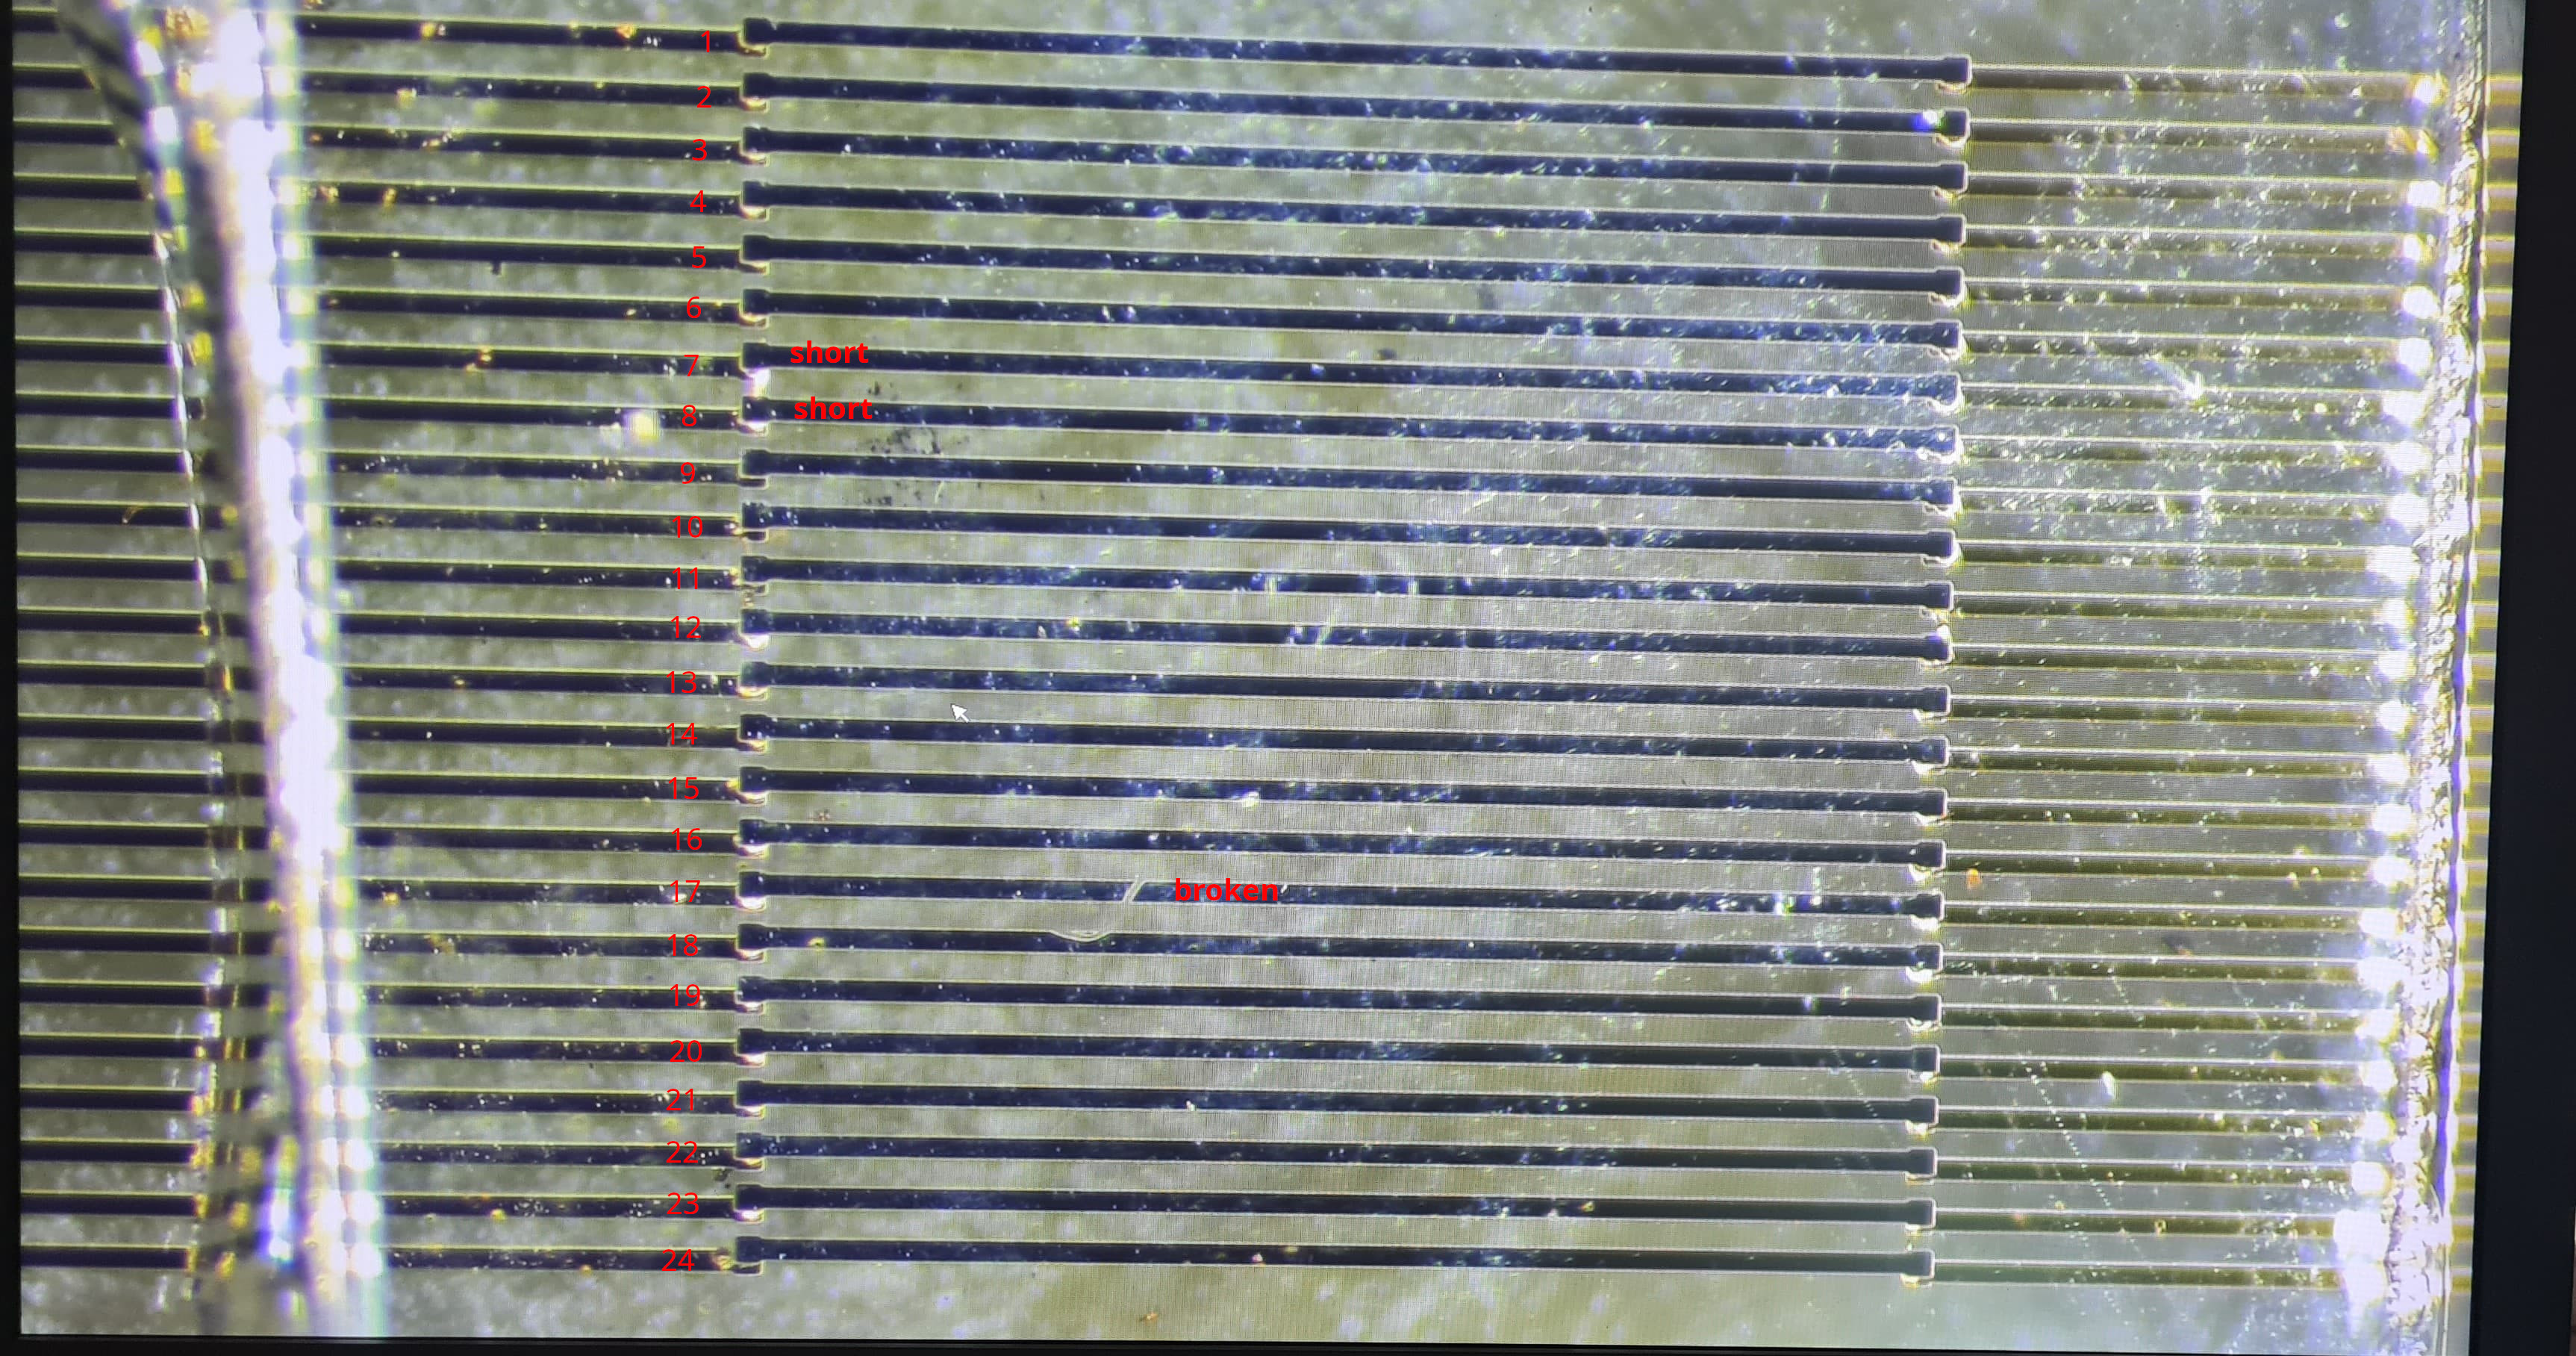
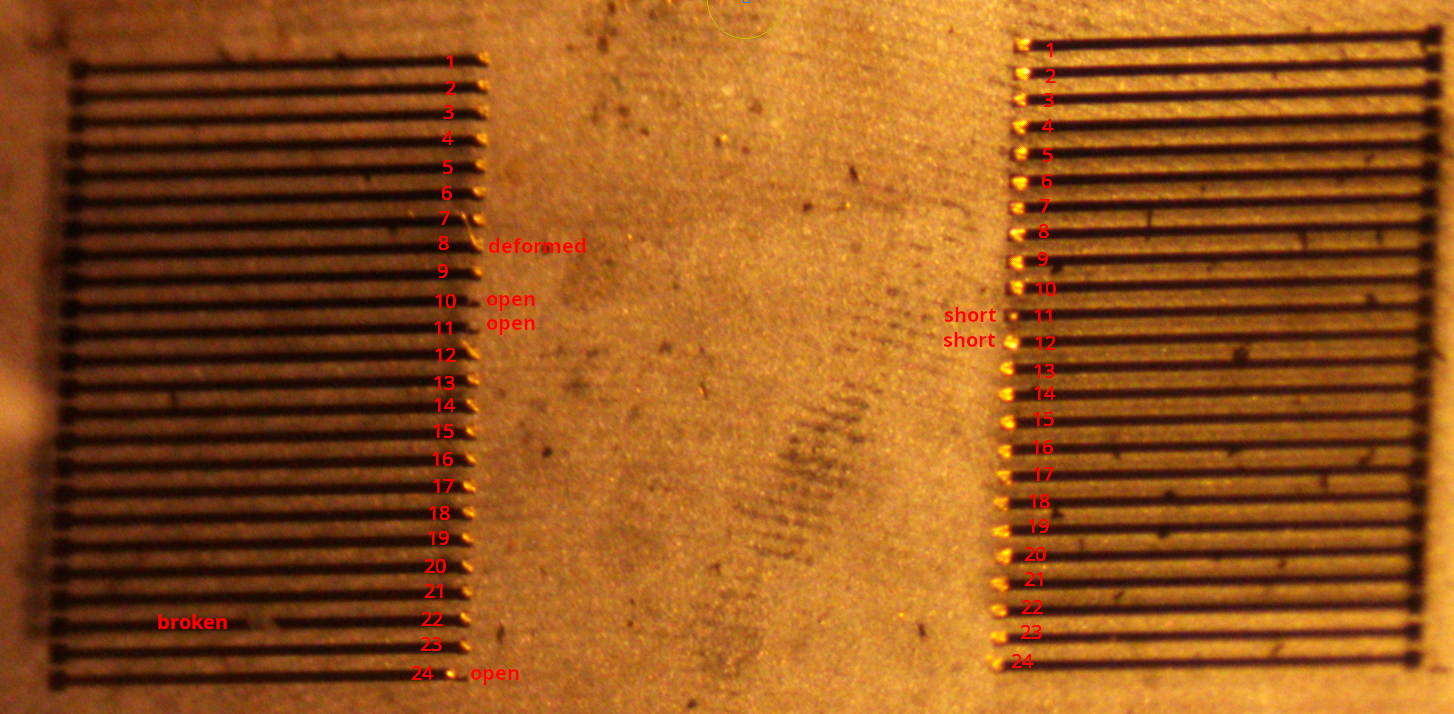
The yield testing as mentioned before is done in such a way that we have 24 line interposer and a 24 line fake die which when flip chipped would form a short between the 2 ends of the lines on the interposer.
24-2 = 22 lines to work with due to interposer and die mask fabrication caused 2 lines to be open does not count towards the gold bump + flip chip yield.
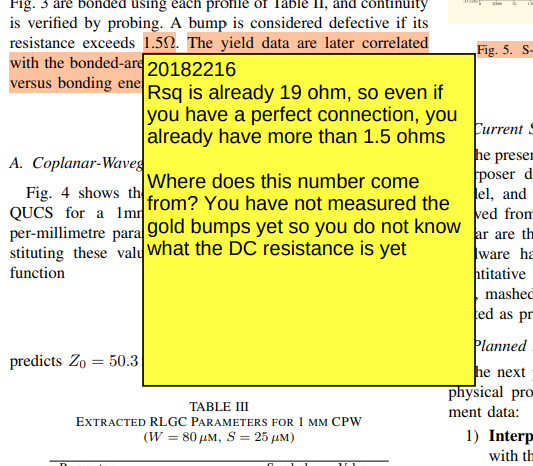
The gold bump placement caused 3 opens and 2 shorts in total affecting 4 lines. Then due to a large tail on one of the gold bumps marked as deformed during flip chip it shorted 2 lines, so in total 6 lines were effected.
6 out of 22 lines are broken leaving us with 16 lines.
- Usable chains:
- Defective chains:
- Bonds per chain:
-
Fraction of defective chains
-
Defective-bond probability (Eq.
)
-
Single-bump yield (Eq.
)
Intermediate Paper Feedback
- title too long try fitting 2 lines.
- too concerned providing numbers, provide more motivation, interpretation, explain how to do things and why you are doing these like that.
- structure of report: 1. Theory, theoretical model, 2. modeling and simulation. Comparison between theory and simulation. Validation of the simulated model vs the design on paper (expectations from the theory). 3. measurements. comparison between simulated models and the measurement results. explain differences.
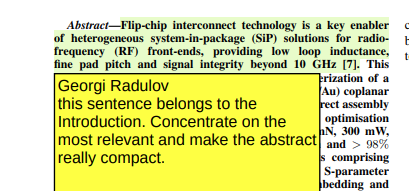
- add footnote on first page, with the context of this paper: BEP project, from to, in which group, supervised by, add all relevant details for the context of the paper.
- maybe dont use the standard bep paper structure, improve to capture specifics of the project.
- write in present simple tense, facts are written in present simple tense, avoid future tense.
- introduction should communicate what has been done and why, right now we are missing the why part, missing the motivation. should better connect the 2 parts of the introduction. EXPLAIN WHAT IS THE PROBLEM dont just jump into numbers. QUANTIFY the problem and tell us how this research solves it. And then put the numbers in the (context of state of the art). Show us how these numbers compare to what the others report in literature.

- MISSING CURRENTLY: Explicit problem definition, Research question and goals of the project, Research approach: what are you going to do in order to reliably reach the goals and answer the research questions, Literature review that connect to the problem definition and the goals of the BEP. Alternative state-of-the-art approaches and examples.
- first refer to the figures in the paper and then only add show them visually.
- Introduce all variables of the equations before using them.
- If results provided, provide interpretation
- “made in simulation is not formulated in a good style” rewrite: modeled and simulated perhaps.
- When writing, think about next student, what can next student use from the report, how can you help the next student have an easier bep.
- Very important to have measurements and concrete deliverables.
- dont use term: continuity.
- what test is used to validate planarity? if not then dont mention.
- where do these opens and shorts occur?
- the flow is used to design… dont used “mapped”.
- dont mentioned aluminium or copper wire we use gold usually.
- dont use “a few” use for example “GHz range”.
- START CITING AT [1]
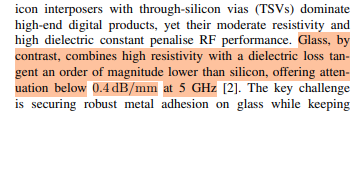 why is this relevant?
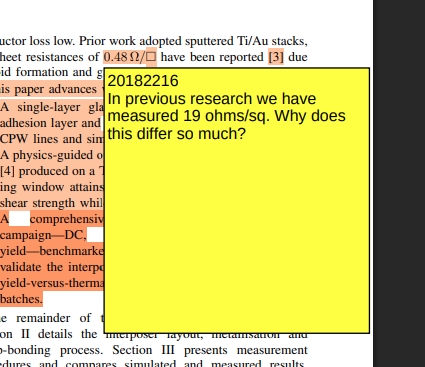
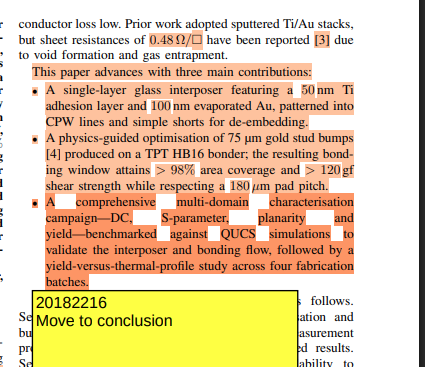
- dont remention things you mention in the table for example.
- dont write what you dont know for sure.
- “coupon is not the right word”.
- do not reference diamensions or somehting without providing reference.
- zoom to relevant structures (USE LATEXT SVG PDF).
- Sideview diagram
- dont use parameter “matrix”
- clear models
- export graphs to matlab and generate better figures.
- not conforting comparing/evaluating
- not wafers, substrates/samples.
- through and short is the same.